When we wrote last year about the 2-year-old LBTT (or Land & Buildings Transaction Tax to give its full name), it had emerged as the Scottish Government’s problem child, leaking away revenues and causing seizures in the middle to upper ends of the housing market.
Its new dad, Cabinet Secretary Derek MacKay, discussed the possibility of changing LBTT’s bands in order to pull its trousers up, as advocated by the Scottish Property Federation and others. This involved lowering the tax bands in certain house price thresholds to ease the pressure on groups like those buying family properties in Edinburgh.
However, over its third year, something unexpected happened – LBTT started behaving and changed from tantrum provoking toddler to a beloved tiny super hero to its Scottish Government parents, so what happened?
Superhuman analytical ability
Using our own superhero vision, we can see that key part of the housing market for LBTT receipts is the £300,000 to £600,000 ‘sweet spot’. Here, just under 10% of the transactions generates around 50% of the income.
It is this market that shifted over the last year. Many buyers, who resisted purchasing due to more prohibitive tax rates introduced above £333,000 in April 2015, came back into the market in force in 2017-18 and shifted the tax take in a much more positive direction.
Figure 1 The £300k to £600k is the key house price bracket (50% of income / 10% transactions)
LBTT Sales & Revenue Distribution
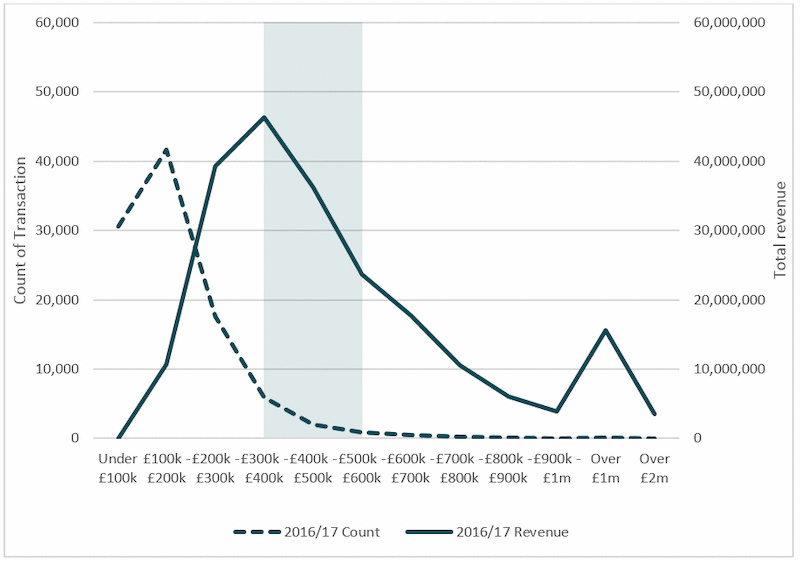
Source: Revenue Scotland
Further analysis demonstrates that the Superman-like take-off in sales above £325,000 occurred from around early Summer 2017, i.e. the time of the UK General Election. There are always dangers in assigning market changes to one-off political events, but it is a reasonable explanation that, following the election result, the realisation that Brexit was going to happen and possibly would not be too bad anyway, as well as IndyRef2 probably being postponed for another few years at least, caused many buyers and sellers who had been looking for excuses not to buy and sell (especially in the higher reaches of the market) to decide to make the leap.
This surge is also evident in the prime £750,000 plus market as well from late 2017, which has continued into 2018.
Figure 2 The second half of 2017 saw a strong upturn on year on year revenue in the middle to higher price bands
12-Month % Change in Rolling Total of LBTT Revenue by Price Band
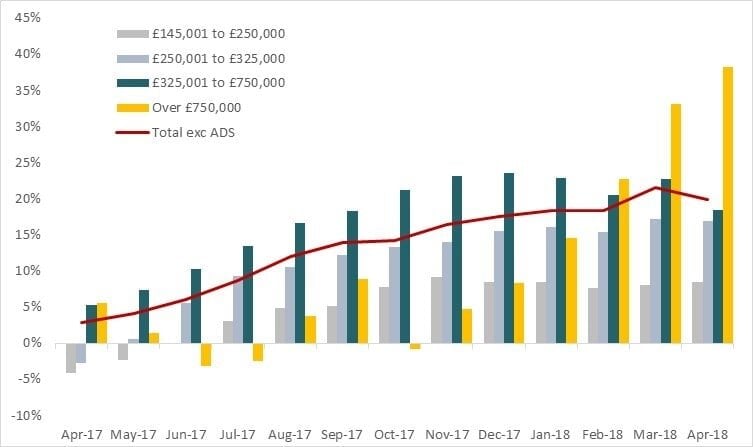 Source: Revenue Scotland
Edinburgh as Smallsville
LBTT is no different from other superheros in needing a home and its preferred home is the major Scottish cities, particularly Edinburgh, where it makes 30% of its receipts from 12% of transactions. In fact, just four postcodes in Edinburgh (EH3, EH10, EH4 and EH12) contribute nearly 20% of all Scotland LBTT receipts. And the vast majority of people buying in the middle to upper price bands in Edinburgh already live here – at the moment, LBTT is heavily a tax on Edinburghers moving house in Edinburgh.
Broadening this to the wider Edinburgh & Lothians housing market, this figure rises to c.40% of receipts from less than 20% of transactions. Of course, many Edinburgh family households see LBTT more as a super villain than a hero, but as long as these households continue to trade in housing, the Kryptonite that might see the destruction of LBTT is kept at bay.
When adding in the other two main Scottish city regions of Greater Glasgow and Aberdeen City & Shire, almost 60% of LBTT is collected from these three Scottish regions. Much more than the old Stamp Duty, LBTT is fundamentally a geography-based taxed.
Figure 3 Edinburgh & Lothians contributes c.40% of LBTT receipts from c.19% of transactions
LBTT Receipts Estimated from Sales in 2017 by City Region
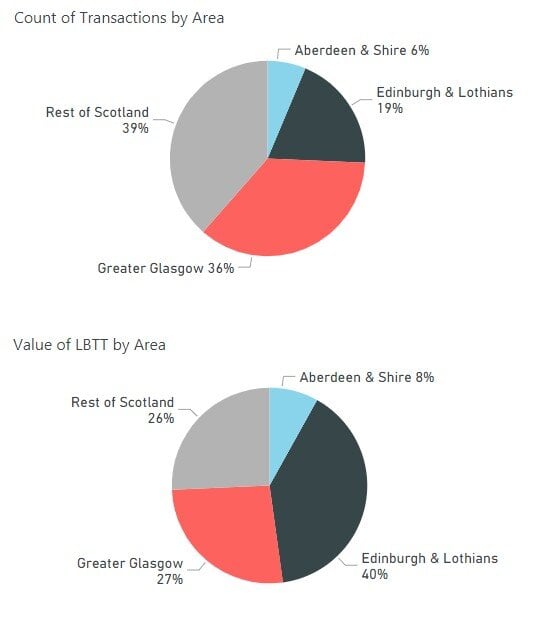
Source: Registers of Scotland
The Superhero’s companion
Playing Robin to LBTT’s Batman, ADS, or Additional Dwelling Supplement levied on second home sales, provided the Scottish Government with a strong (and unplanned for) windfall when introduced by the UK Government in April 2016 and replicated up here.
Together, this super tax duo have pushed up receipts, taking the Government beyond its revised forecasts, and with ADS now contributing close to one-third of the total LBTT take. However, it is worth noting that LBTT (even with ADS) is still behind the Scottish Government’s original forecasts made when the tax was first introduced.
Figure 4 ADS is a strong supplement to base revenue
LBTT Outturn vs. Annual Budget Forecasts & Revisions
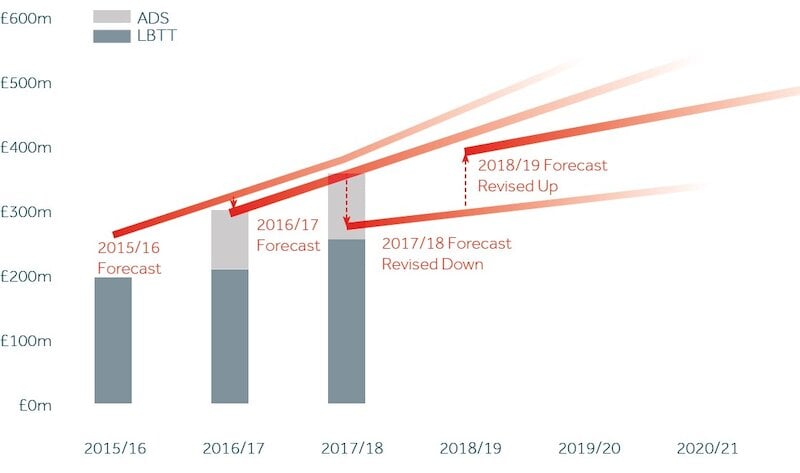
Source: Revenue Scotland
Can its super powers last?
Like every superhero, LBTT knows that its success can only last as long as it powers, so are there any signs that these are fading?
Data from property being listed can be instructive in this regard. Although not every property listed will translate into a sale, listings provide much more up-to-date evidence than sales, which can often take several months to register.
Data from Edinburgh for 2018 to date demonstrates that listings are up year-on-year in the key £325,000-£750,000 band, although there has been a sharp contraction in the £750,000 plus market. Nevertheless, this is a largely positive signal that LBTT’s new found powers are not diminishing any time soon.
One of LBTT’s main powers is Fiscal Drag, a power that Government loves all its taxes to have. It basically drags people gradually into higher bands of taxation as their earnings or spending rises when there is no inflation adjustment of the tax bands. Over time, the tax take inevitably rises well ahead of inflation. With house prices almost inexorably moving northwards over time, this LBTT power will likely strengthen in the future.
Figure 5 The £350k to £750k market is performing strongly in Edinburgh in 2018 to date
Comparison of 2018 vs 2017 Advertised Property Listings in Edinburgh by Price
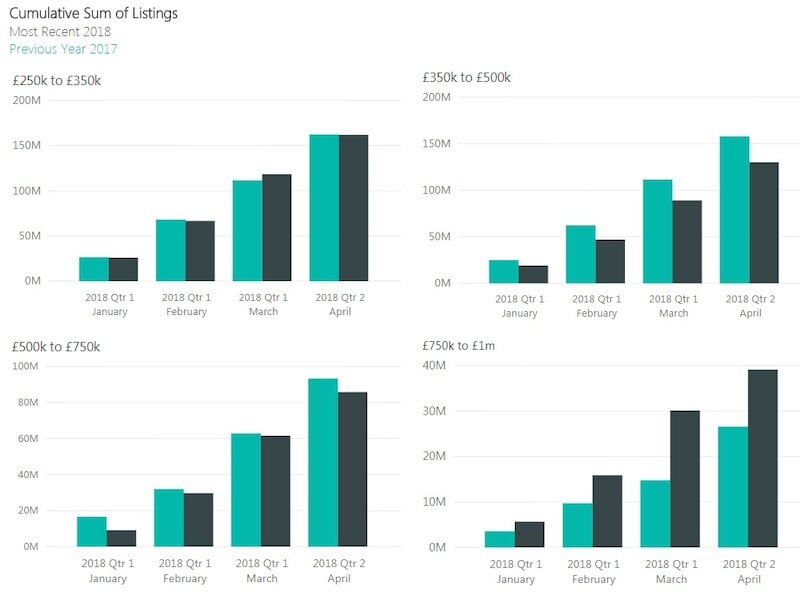
Source: Rettie Research Listings
Could we enhance its powers?
For all superheroes, there is always some damage in its adventures. And the likes of the Edinburgh middle class will certainly feel that LBTT has smashed its way through their savings in its quest to do-good.
If we accept that LBTT is here to stay, could we look at ways of enhancing its powers while limiting the damage? Adjusting the bands is still an option that should be considered. The fillip caused by the UK General Election shows how rapidly the market can bounce on sentiment, with sales in the key LBTT price bands rising over 20-40%. By providing an actual monetary saving in moving house through adjusting the bands, the Government could stimulate the market further and create more revenue. We estimate that with housing transactions still around one-third down on 2006/7 levels, despite rising population and household numbers, that rebanding to extend the 5% band to £500,000 would push the effective tax rate above 4% from £445,000 to £590,000. Reduced transaction costs would encourage trading up, relocation and downsizing, in turn impacting on market activity across all price brackets. Another 25% increase in activity, still well below peak levels, would see a neutral, or small gain, in residential LBTT revenue, while reducing the burden on key buyer groups in certain geographies. It is not prudent to have an important source of government income to be so narrowly based (if house sales in these areas slow, the tax revenues will be seriously impacted).
So, it has been a year of dramatic change in the short life so far of LBTT. It has bludgeoned its enemies with the power of its receipts and shows no sense of its appetite for such receipts dwindling.
While family house buyers may shirk in its wake, there is little doubt that its Scottish Government parents are happy with its growth spurt. Growing by the same amount again, however, is going to be a challenge, which mean its bands should be kept under close review.